Creating a Times Tables Grid Using JavaScript
Times tables are a big thing in primary schools. Parents care about them, teachers love them and children (usually) fear them! Their importance is understandable though because they are so crucial to so many areas.
For example…need to know how many carrots to buy your four goats to make sure they get their daily dose of 6 juicy vegetables? Times tables. Can’t work out how many pieces of pizza on your rectangular, cheese-crust filled, pepperoni topped meal tonight? Times tables. Desperately want to know what three-eighths of a bag of wine gums adds up to? You guessed it.
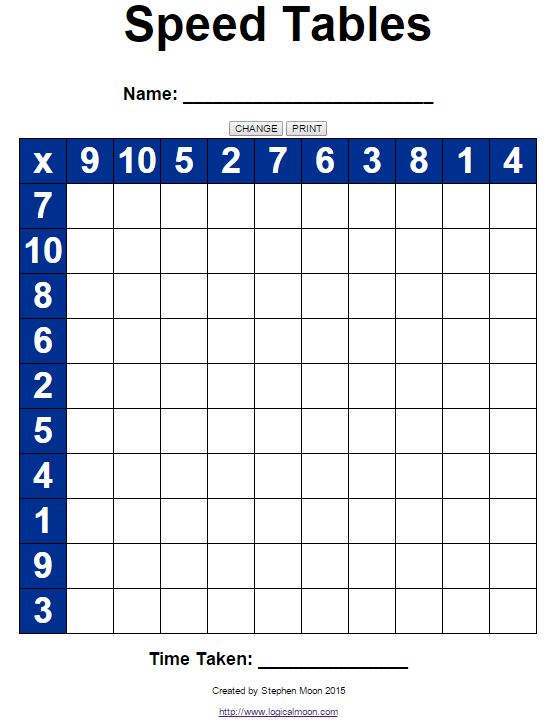
Testing and learning times tables can take many flavours but one way is to use something like this at Primary Worksheets.
This page is really popular because it’s dynamic, takes little work to print and uses and ticks many of the boxes for what teachers need to test them each week. I won’t dwell on that though because my task is to make it using JavaScript.
I have a couple of reasons for this, beyond just practising, but the main one is that the original is written in Flash and who knows how long that will remain working. There are three things that I want to concentrate on then for this mini-project but of course, you can see everything by looking at the source code here.
- Generating the grid
- Making it dynamic
- Hiding the buttons when printing
Generating the Grid
Let’s start by describing the grid and how we can reference particular elements in it.
1 | <div class="tables-grid"> |
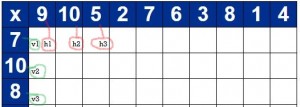
Imagine this. The grid where children put their answers is 10x10, with 10 rows and 10 columns, representing the answers for each of the tables. Then we need a row along the top. That will have one unused box, followed by the 10 numbers that we multiply. Down the left side we have a further 11 boxes (including the one we already mentioned in the top-left). Let’s take a quick look at how this appears:

To use it, you simply multiply each number together and write the answer in the intersection. So, we’d do 7x9, 7x10, 7x5 and so on, moving onto 10x9, 10x10. In the image above, you can also see how I named the key cells using h1 through to h10 for the first row and v1 to v10 for the left-most column (or at least you would if I didn’t chop it off at the third row). The letter “x” is in the top left hand cell, signifying you need to find the product of these. So, all we need to do is to change the values of these cells and we have a working grid which we can print and use.
It does need to change, too. Children can learn old questions much easier than they learn random tables!
Right, then. Now let’s zoom in on how I take those and fill in the required cells automatically.
Making it Dynamic
To get the complete picture, let’s start with the HTML button labelled CHANGE.
1 | <input class="buttons" type="button" value="CHANGE" onclick="FillTablesGrid()"/> |
When that button is clicked, the function FillTablesGrid() is called. But that isn’t the whole story. Did you notice that the grid had the tables numbers already filled in the front row and down the left-most column as soon as the page appeared? That was thanks to a small piece of jQuery which executed as soon as the page was ready.
1 | $(document).ready(function () { FillTablesGrid(); }); |
So what exactly happens in this function?
1 | function FillTablesGrid() { |
Firstly, we get two arrays of 10 numbers. One will be used for the first row and the second for the first column. I won’t go into detail about how to generate a list of 10, non-repeating numbers, because I already did it here but do take a look if you haven’t or the rest of this might not make as much sense.
Then, for each number of the arrays, we reference the required cell (horizontal first, then vertical) and fill it’s text portion (using text()) to be equal to this value. That’s what is happening on lines 6-7. Actually referencing the cells might be worth spending a couple of sentences on. When you see this:
1 | $("#h" + (index + 1).toString()) |
what is really happening is that we are building a string, which refers to an element (via its id name) using jQuery’s syntax. In the example above, if index was equal to zero (as it would on the first pass through the loop) that would be #h concatenated with (0 plus 1) -> #h1. Clear? Also, remember that .table references the attribute of the anonymous object containing the actual times table. You did look here, right? I did say it was important :-)
Hiding Buttons
In the original web app, when you press the print button, all those buttons disappear. That makes sense because they really don’t have a place on a printed sheet, but how do you do it?
1 | function PrintTablesGrid() { |
This is a small function which is attached to the print button.
1 | <input class="buttons" type="button" value="PRINT" onclick="PrintTablesGrid()"/> |
What makes this do what we want, though, is the fact that I labelled this element as being part of the class buttons. Using jQuery, line 2 above tells JavaScript to hide all elements that are part of that class, then we try to print the screen, and once that is done, we make those class elements magically reappear. All of this happens so fast that you don’t see the cogs spinning, of course.
So there you have it: one shiny new times tables grid.

There are a few ways in which you could improve though such as perhaps not having the full 1-10 multiplications or repeating some of the columns so that you focus on the 2x or whatever.
One commenter asked if he could have the grid go up to 12x12 so I have added that here. Why not have a go?
By the way…if I recall correctly, I taught a child who could do this in just over a minute. Beat that!
Hi! Did you find this useful or interesting? I have an email list coming soon, but in the meantime, if you ready anything you fancy chatting about, I would love to hear from you. You can contact me here or at stephen ‘at’ logicalmoon.com